Breaking the limits of TLA+ model checking
I haven’t written much about TLA+ on the blog since the new learntla went up. Any examples or special topics I think of go there instead. But I recently thought of a cool demo that doesn’t quite fit the theme of that book: there are some things you can’t easily check with the model checker but can check if you work with the state space as a directed graph.
Take for example observational determinism (OD): does an algorithm always converge on the same answer? Let’s use the example of four threads, each nonatomically incrementing a counter once. To show that the final value of x isn’t always 4, you just have find one trace where it’s not 4. But to show that the final value is inconsistent, you have to find two traces that get different answers! The TLA+ model checker (TLC) can do the first but not the second.
Show spec
------------------------------ MODULE threads ------------------------------

EXTENDS Integers
Threads == 1..4 \* four threads!
(* --algorithm threads

variables
  x = 0;

process thread \in Threads
variables tmp = 0;
begin
  Get:
    tmp := x;

  Inc:
    x := tmp + 1;
end process;

end algorithm; *)
====
If you wanted to test for observational determinism, you’d normally have to mimic it with some hairy “hypermodeling” tricks I wrote about here. Not only is this difficult and fragile, it’s also really inefficient. The regular model has only 755 distinct states, while the hypermodel has over 100,000! It’d be much easier if we could “step outside” the model checker and just examine the state space directly.
So I started looking for a way. And I got a lot further than I expected, well past checking OD and all the way into finding probabilities! If you want to poke around with any of the components, you can download the whole project here.
Steps
1. Get the state space dump
This is easy, just model check with -dump dot,actionlabels file. TLC will output a graphviz file.
strict digraph DiskGraph {
nodesep=0.35;
subgraph cluster_graph {
color="white";
2665600213816166005 [label="/\\ x = 0\n/\\ pc = <<\"Get\", \"Get\", \"Get\", \"Get\">>\n/\\ tmp = <<0, 0, 0, 0>>",style = filled]
2665600213816166005 -> -1245546546836852765 [label="Get",color="black",fontcolor="black"];
// 2000 more lines
That’s… going to be hard to work with.
2. Clean up the file
Let’s replace the node ids with something a little more readable. I wrote a script to replace each node id with a short string. The first node in the file is renamed to “a”, the second to “b”, the twenty-seventh to “ab”, and the 5796th to “aaa”. I took this as an opportunity to learn some Rust.1
Show code
//use std::io;
#![allow(unused_imports)]
#![allow(dead_code)]
#![allow(unused_variables)]

use std::fmt;
use std::fs;
use std::path::Path;
use std::env;
use regex::Regex; // 1.7.1
use std::collections::HashMap;

fn num_to_id_str(id: u32) -> String {
    let mut out: String = String::with_capacity(5);

    let mut id: u32 = id;

    while id != 0 {
        id = id - 1;
        out.push(((id % 26) + 97) as u8 as char);
        id = id / 26;
    };
    out.chars().rev().collect::<String>()
}

fn next_id_str(id: &mut u32) -> String {
    *id = *id + 1;
    num_to_id_str(*id)
}


fn main() {
    let mut id: u32 = 0;
    let mut replacement_table: HashMap<&str, String> = HashMap::new();

    let args: Vec<String> = env::args().collect();
    let file_path: &str = &args[1];
    let out_path: &str = &args[2];
    let graph = fs::read_to_string(file_path)
        .expect("Should have been able to read the file");
    let mut out = String::with_capacity((&graph).len());

    let re = Regex::new(r"-?[[:digit:]]{10,}").unwrap();
    let unchanged_chunks = re.split(&graph);
    let mut text_words = re.find_iter(&graph); //needs to be mut for iteration

    for chunk in unchanged_chunks {
        out.push_str(chunk);
        match text_words.next() {
            Some(mat) => {
                let key = mat.as_str();
                if !replacement_table.contains_key(key) {
                    replacement_table.insert(key, next_id_str(&mut id));
                }
                out.push_str(replacement_table.get(&key).unwrap());
            }
            None => continue
        };
    }
    fs::write(out_path, out).expect("Unable to write file");
}


#[cfg(test)]
mod tests {
    use super::*;
    #[test]
    fn it_increments() {
        let mut id: u32 = 0;
        next_id_str(&mut id);
        next_id_str(&mut id);
        assert_eq!(id, 2);
    }

    #[test]
    fn str_generator() {
        let results: Vec<String> = vec![1, 2, 25, 26, 27, 28, 52, 53].iter().map(|&x| num_to_id_str(x)).collect();
        assert_eq!(results, vec!["a", "b", "y", "z", "aa", "ab", "az", "ba"]);
    }

    #[test]
    fn incrementor_and_generator() {
        let mut id: u32 = 0;
        next_id_str(&mut id);
        assert_eq!(next_id_str(&mut id), "b");

    }
}
3. Try Gephi
Gephi is a graph analysis tool. I used it because it was the first tool I found. There’s probably better ones out there.
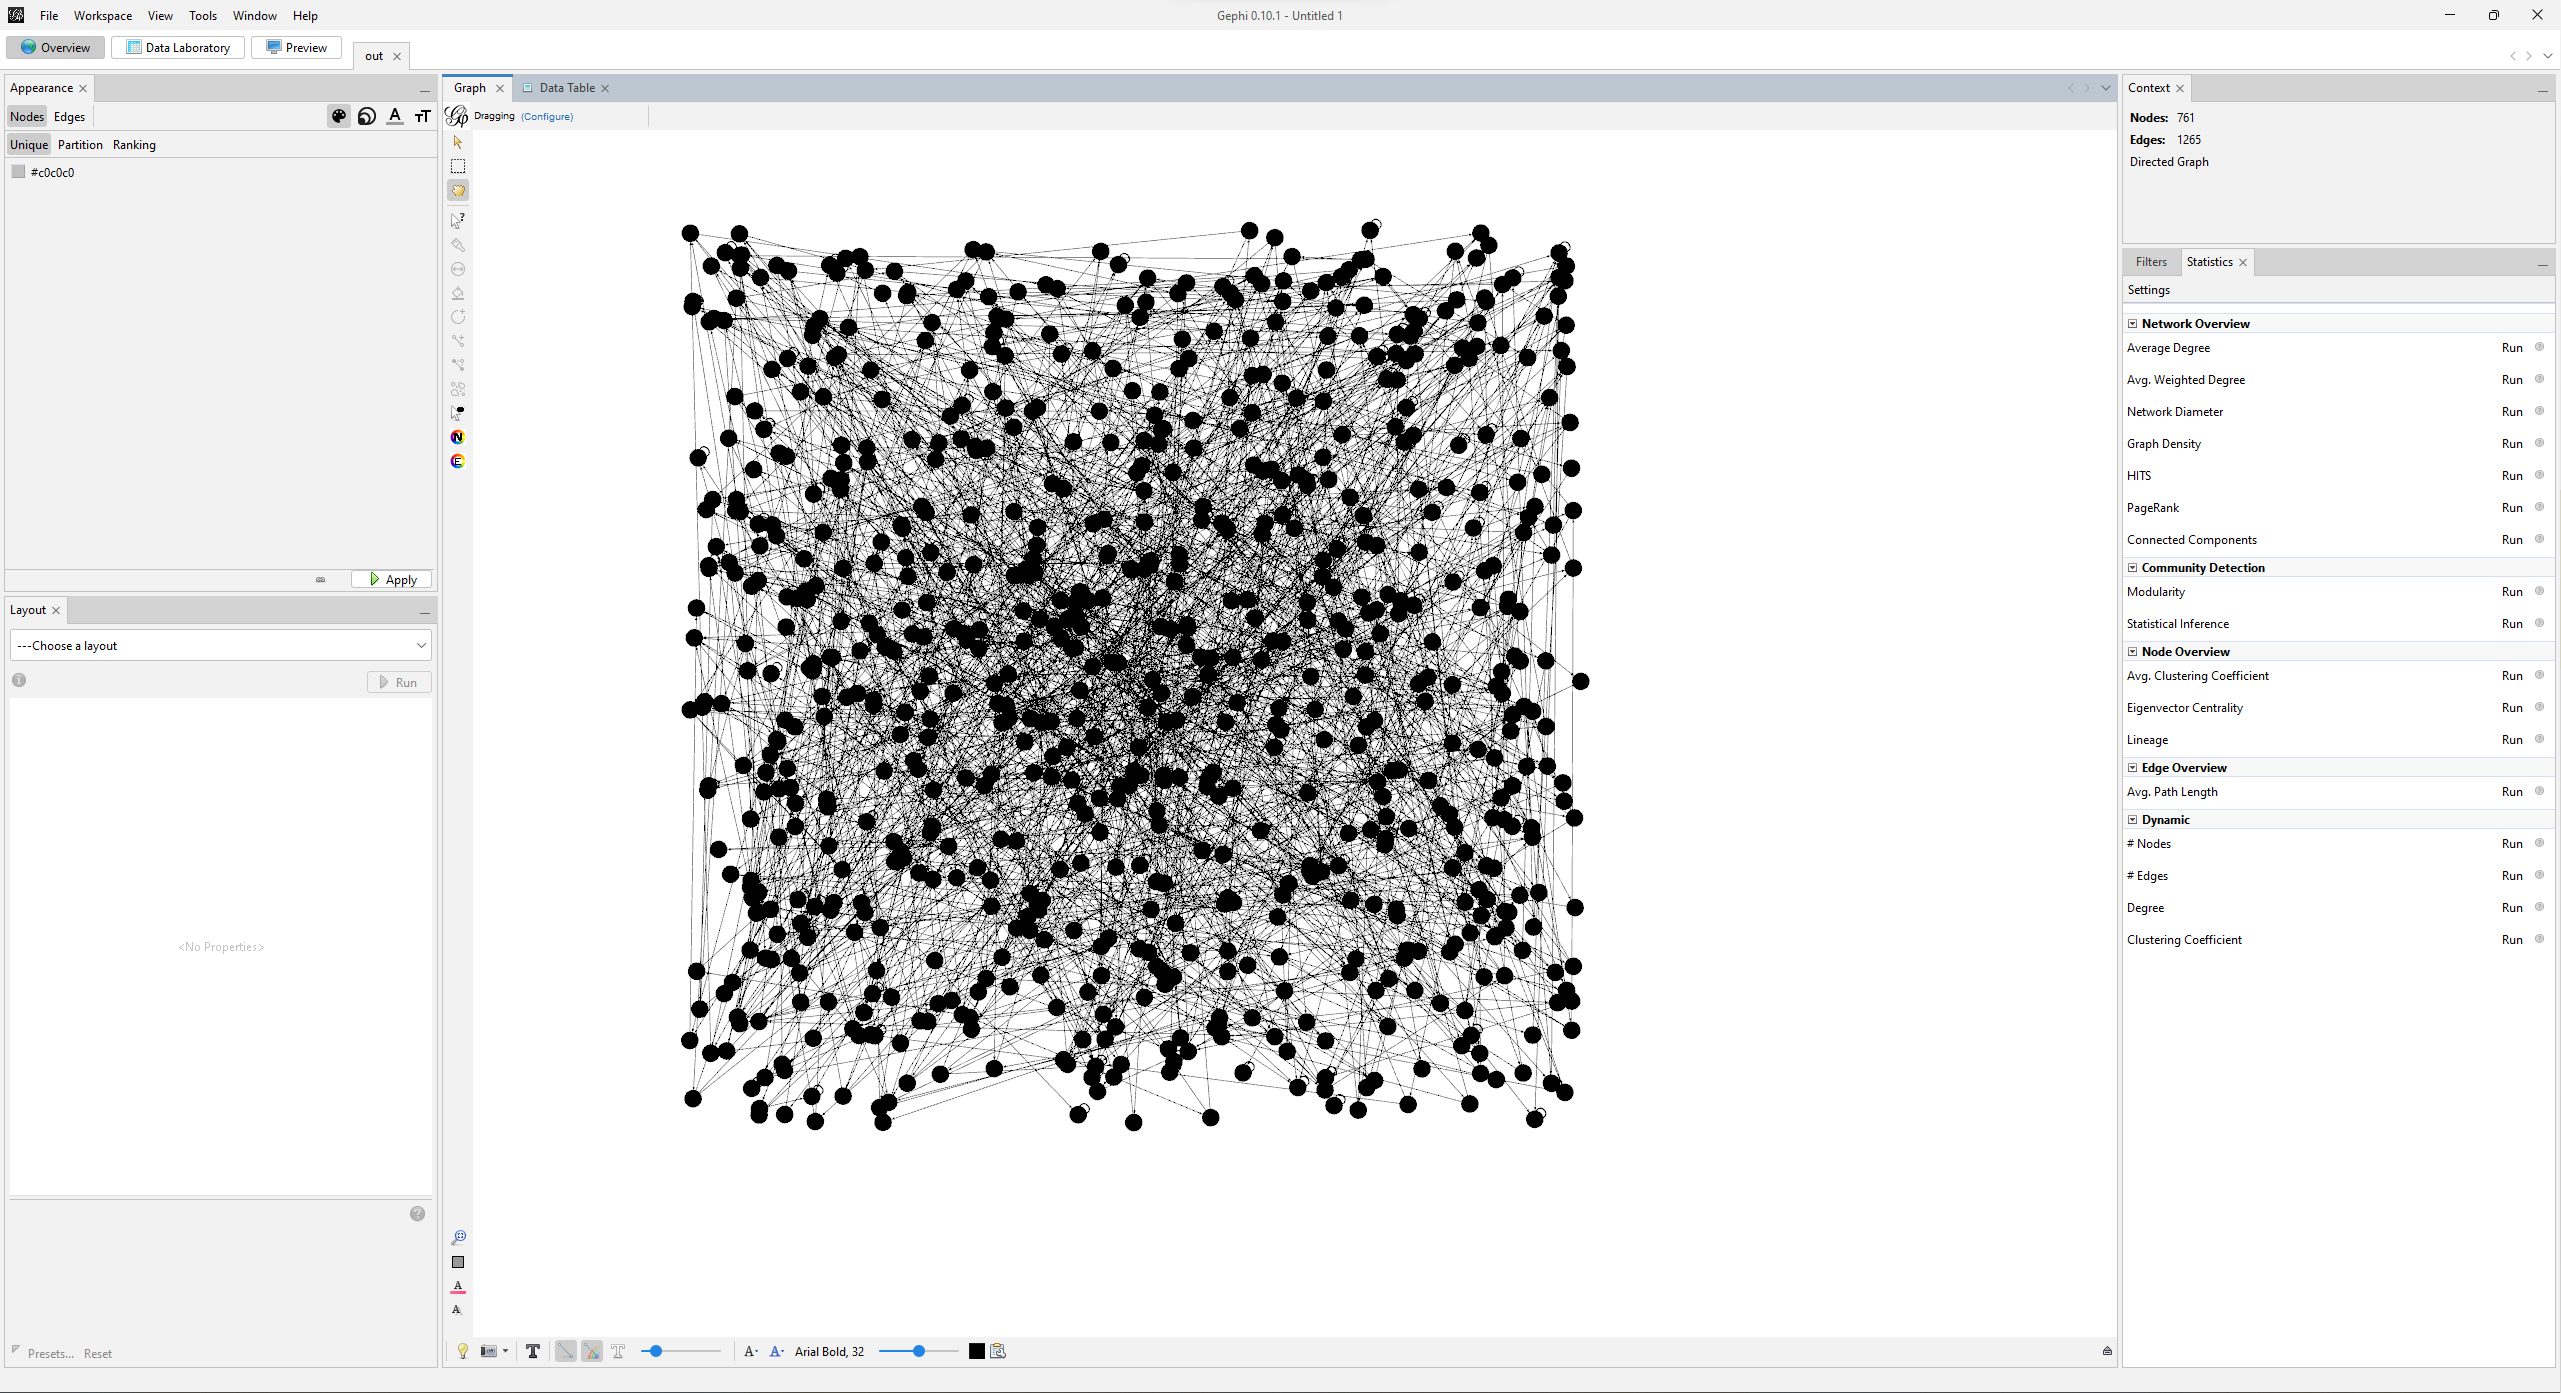
Uhhhhhh that’s a mess. Let’s run a layout algorithm to make it at least tractable.
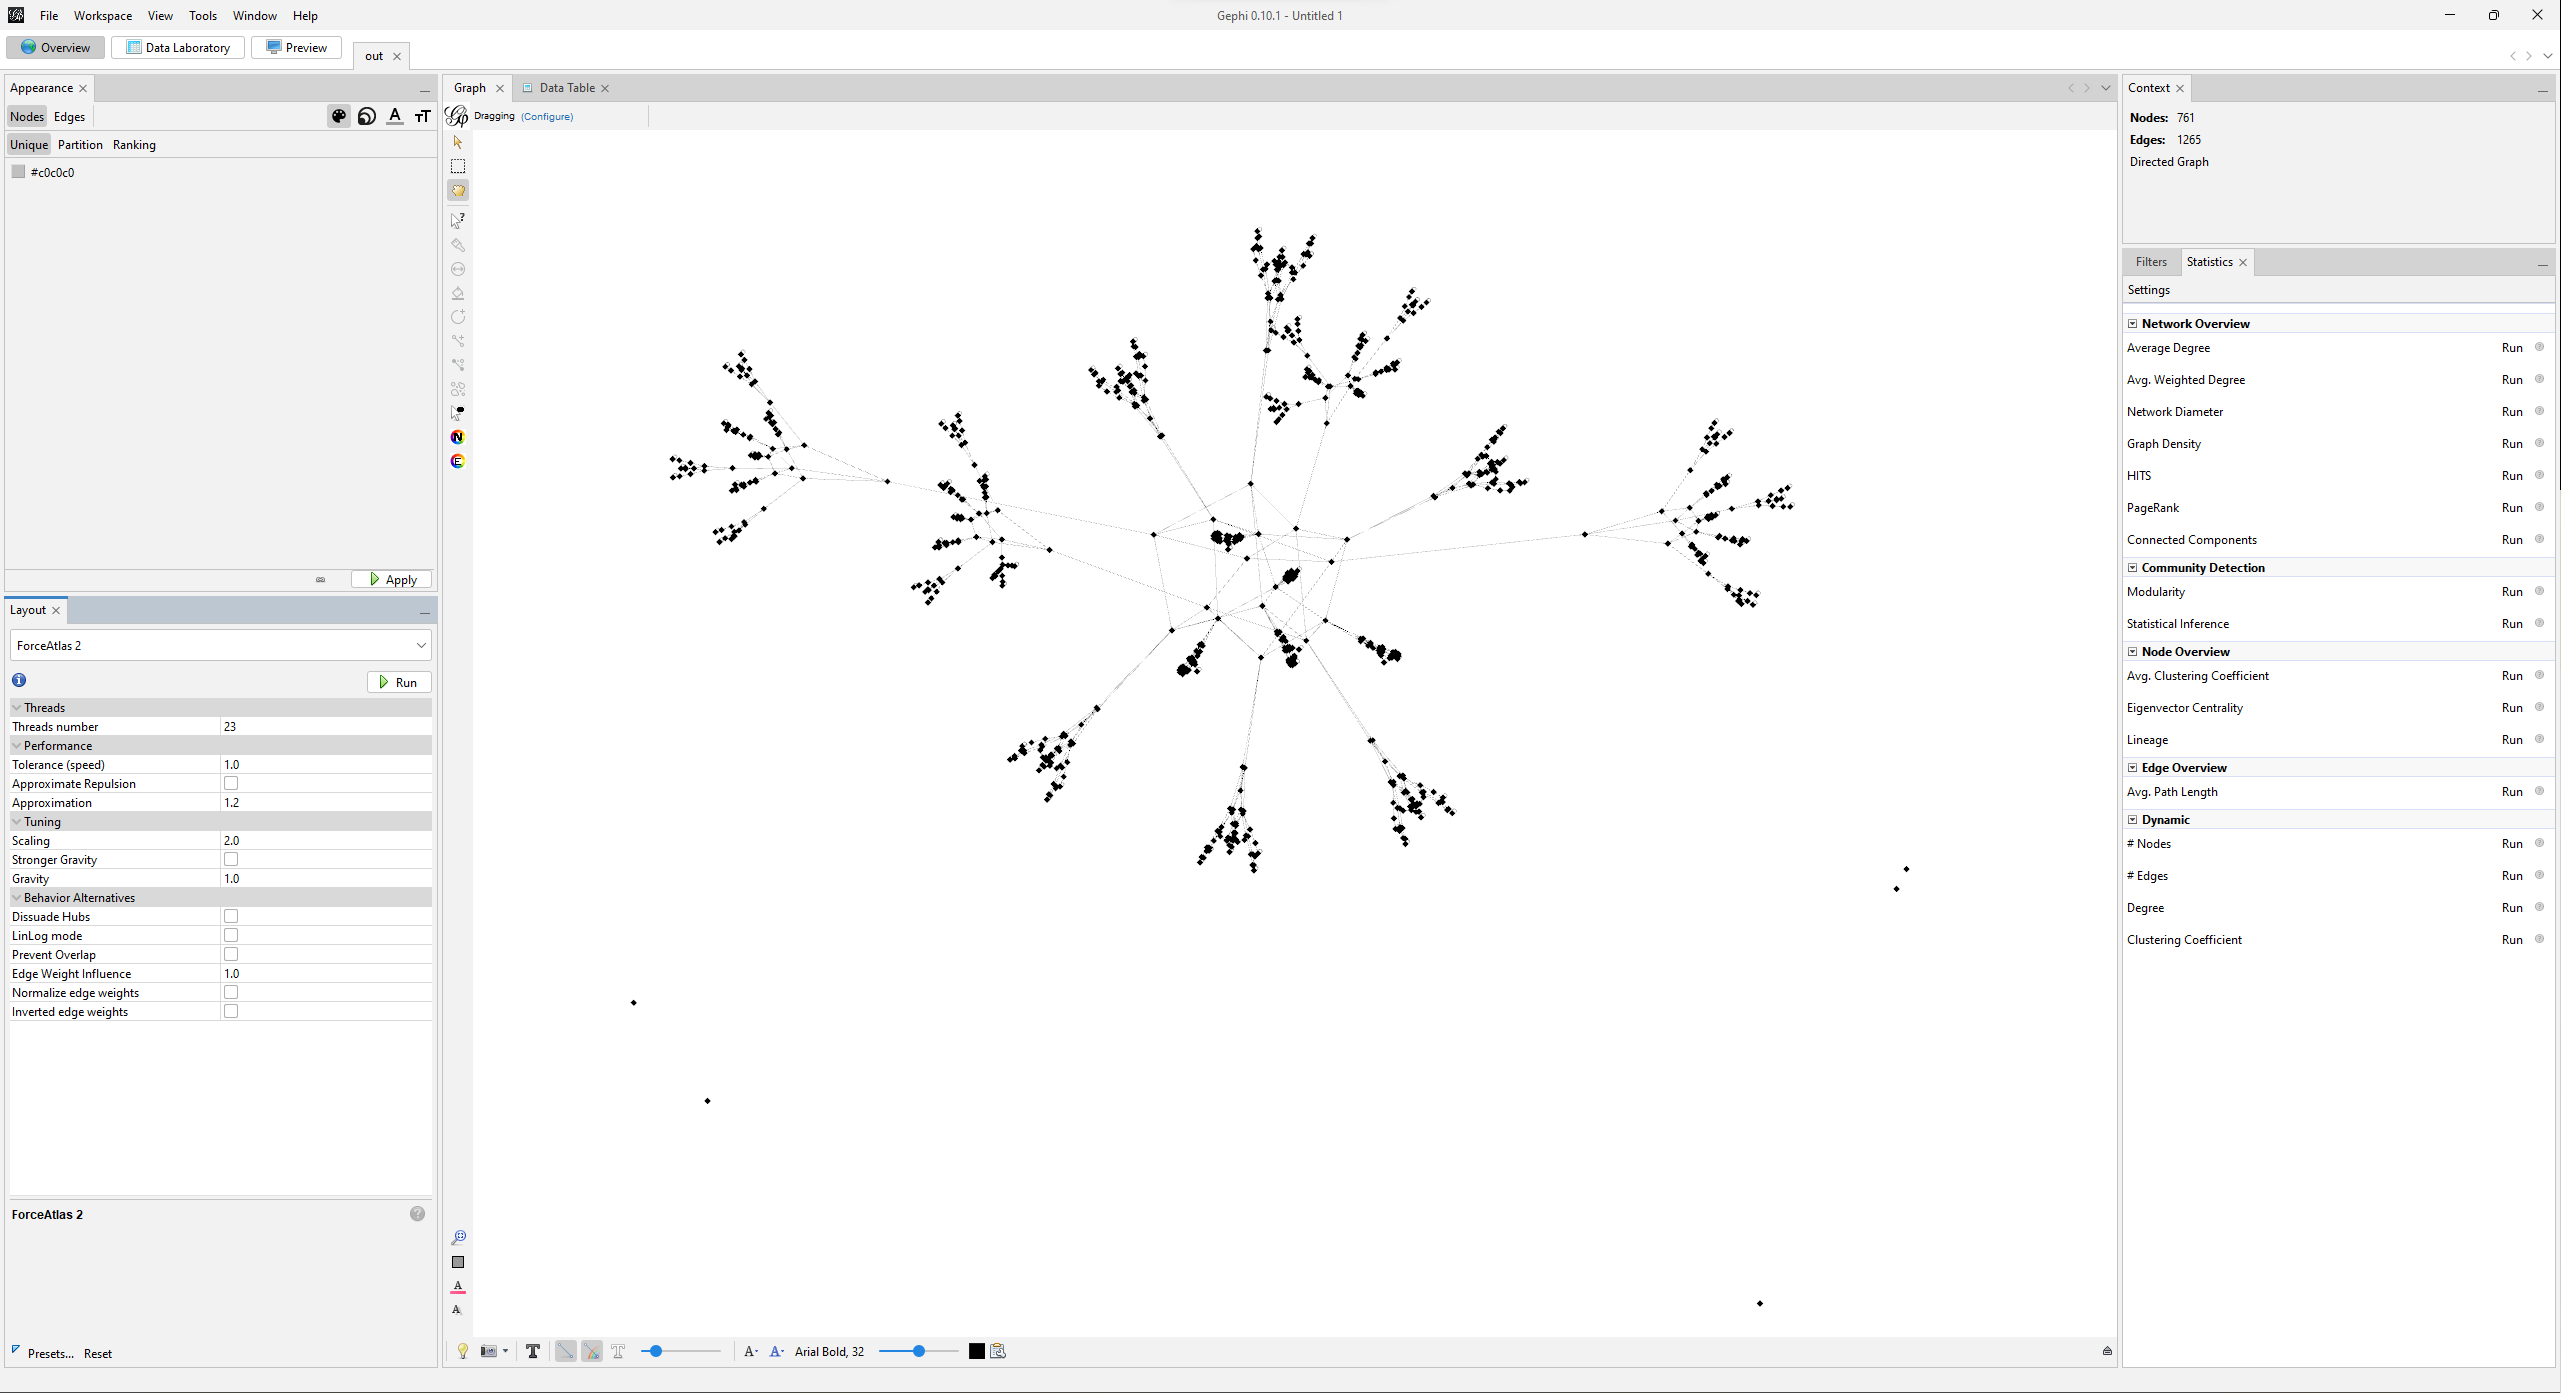
That’s a little better. Those little dots on the bottom of the graph are graphviz options that got accidentally turned into nodes. I went through the data table and manually deleted them.
4. Discover that Gephi is terrible
Gephi can make nice looking graphs and not much else. After fighting through the terrible documentation and UX I managed to filter for initial and terminal states. You can see the queries on the right-hand side of the window. Once I got the filters working I added a “Type” data column and labelled the corresponding states. That way I could assign special colors to root and terminal nodes.
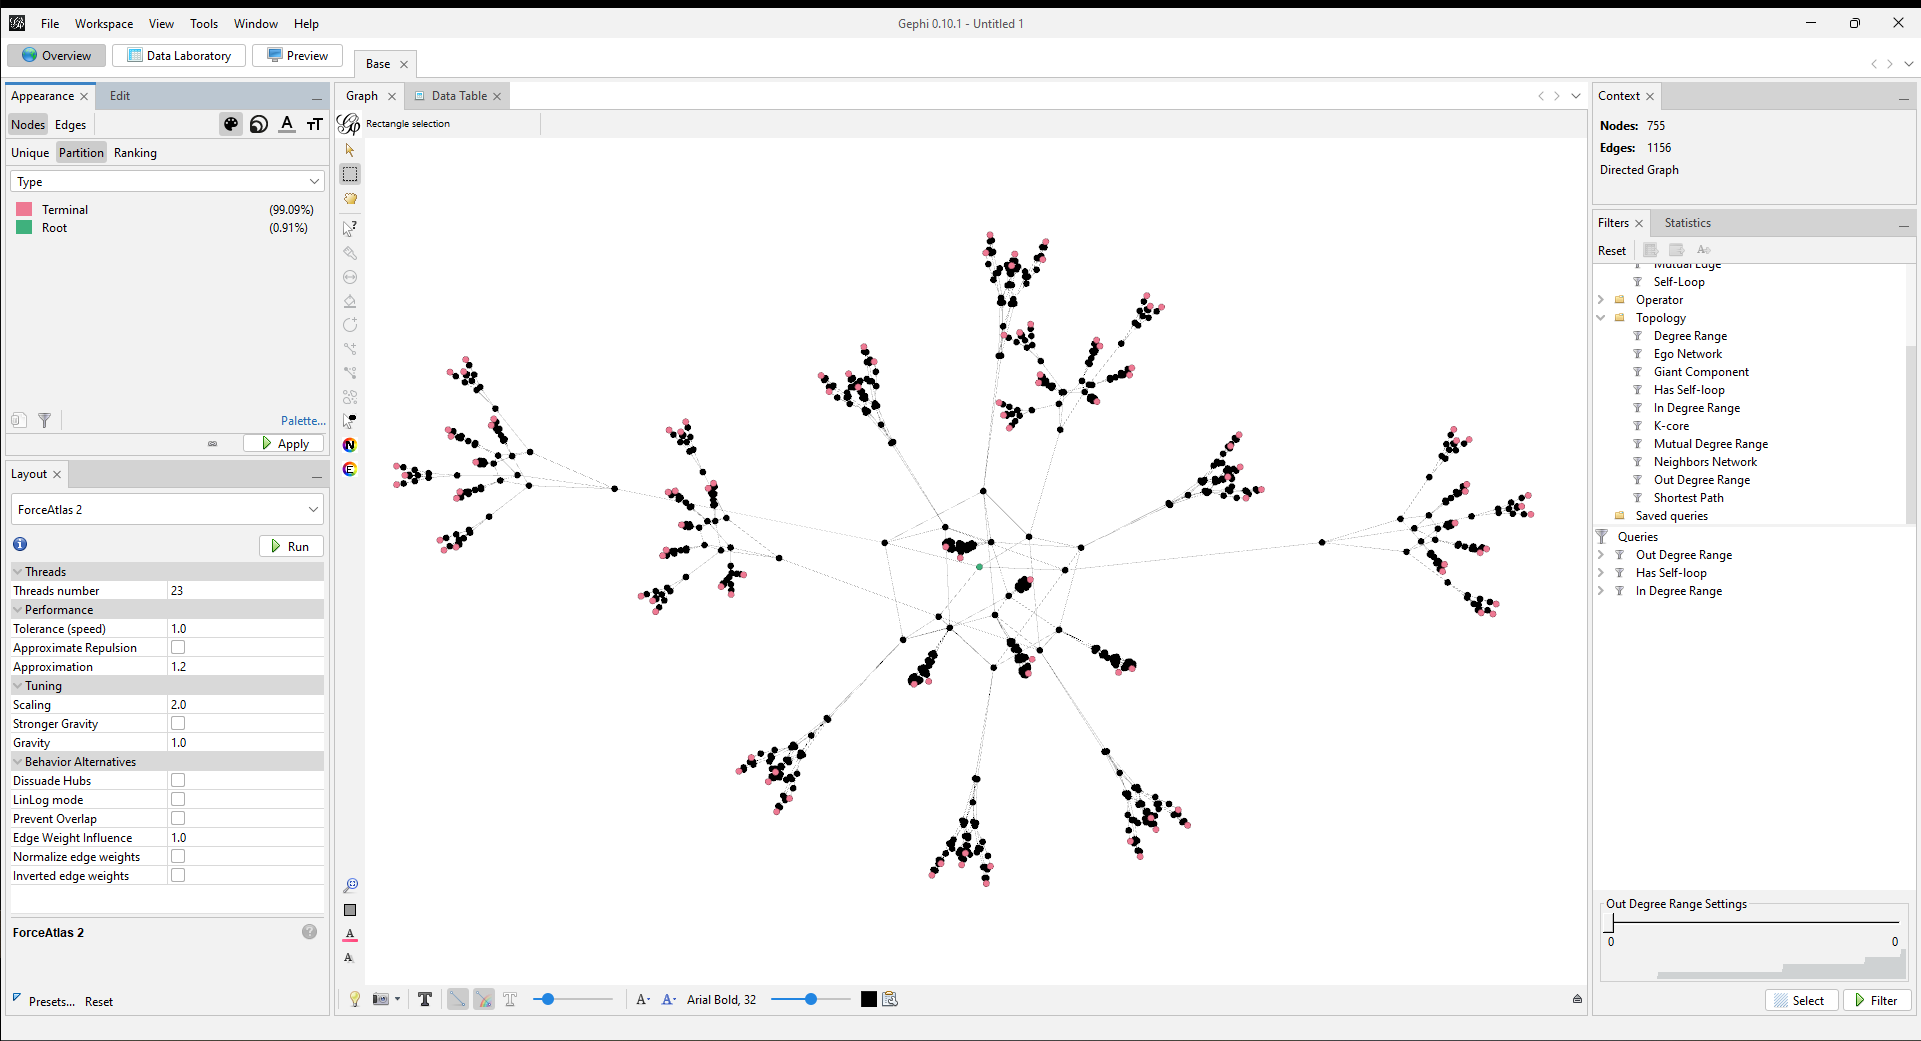
After that, I could manually look through the terminal nodes and see that they have different values of x.
Okay, so OD is refuted. I’m interested in checking more than just observational determinism, though, and I wanted to see what else Gephi could do. To start with, I wanted to extract the x value from the label and put it in its own column. After that, I’d see which values are most common in terminal states.
This is where I learned that Gephi hates me.
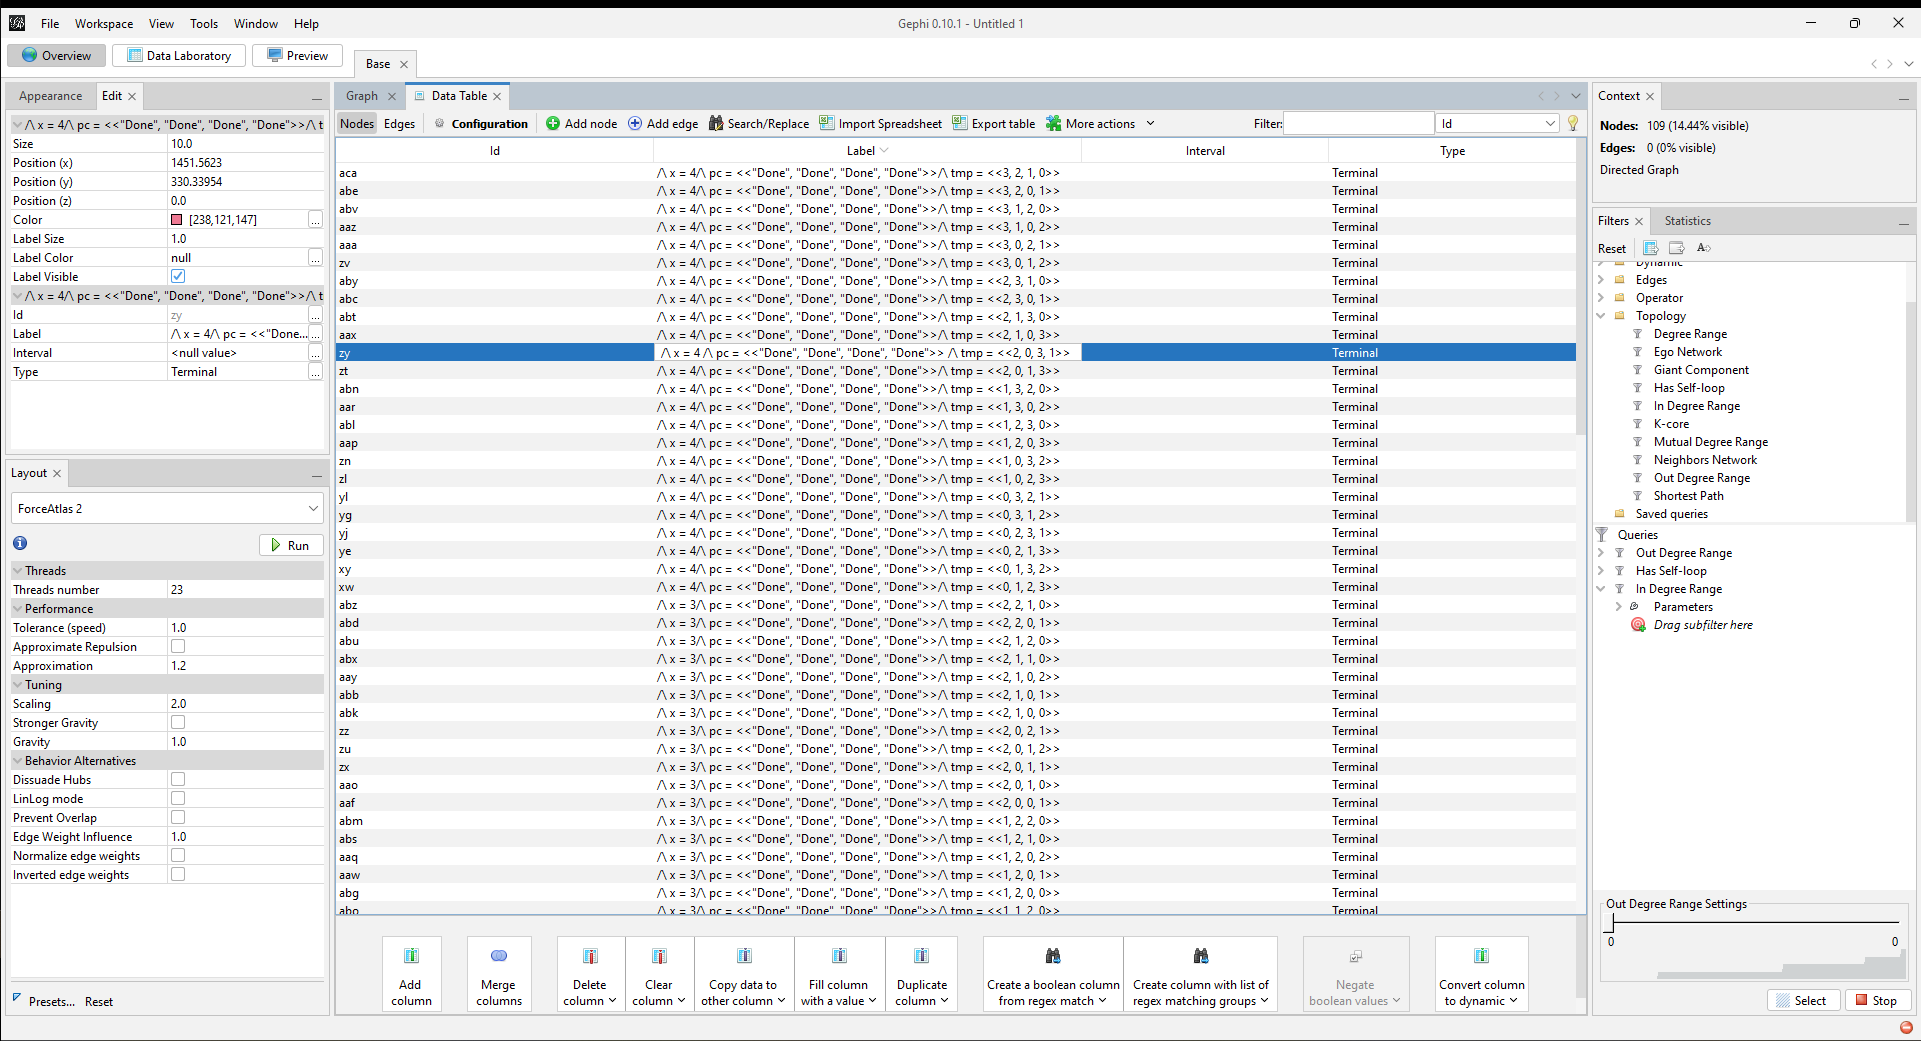
The only way to extract x is to duplicate the column and do a regex find/replace on the whole string. Gephi defaults to running the find/replace on every single column and resets that default every time you reopen the find/replace modal. If you forget to re-enable it just once then it’s time to reload the graph and start over, because there’s no way to undo changes.
In fact nothing in Gephi is undoable, and nothing is well documented, which together make the system inscrutable. You can’t learn what buttons do and you can’t safely try them out, especially when some buttons do things like “wipe all your layout and customizations and go back to grey blobs.”
…In retrospect, I should’ve guessed Gephi was a dead end.2 I don’t want to repeat painstaking manual labor every time I change the spec. What I really want is a software library.
(Unrelated, it’s interesting that most languages don’t have a graph type in their standard library. I’m guessing it’s because graphs have lots of different representations, which also have very different performance and API considerations.)
5. Start over with NetworkX
NetworkX is a graph analysis library. I used it because I already know Python. There’s probably better ones out there.
NetworkX represents graphs as a dict of dicts of dicts.3 As far as I could figure out, you have to implement graph operations imperatively. For example, to extract x from the label, I had to iterate through every node and add x as an attribute.
for node in G:
    label = G.nodes[node]["label"]
    x = re.search(r'x\s*=\s*(\d+)', label).group(1)
    G.nodes[node]["x"] = int(x)
To find the terminal states, I first removed all the self-loops, and then filtered for all the nodes with zero outbound degree (no outbound edges).
G.remove_edges_from(nx.selfloop_edges(G))
terminals = [n for n, deg in G.out_degree() if deg == 0]
After that, I can pull all their x attributes to see the spread.
from collections import Counter
Counter([G.nodes[t]["x"] for t in terminals])

# output
Counter({4: 24, 3: 36, 2: 26, 1: 23})
So there are some end states where x=4 and some where x=3, proving that our system is not observationally deterministic.
6. Go mad with power (and probability)
Something I wasn’t expecting: x != 4 in three quarters of the end states. That seems really high for a race condition! I implemented the spec in C++ and it only had the race condition 0.1% of the time.4
Show C++ code
#include <iostream>
#include <thread>
#include <vector>

const int NUMRUNS = 30000;
const int NUMTHREADS = 4;
int x = 0;
bool wait = true;

void *increment_x()
{
    while (wait) {;}
    int tmp = x;
    tmp = tmp + 1;
    x = tmp;
    return NULL;
}

int main()
{
    int results[NUMTHREADS] {0};
    std::vector<std::thread> threads(NUMTHREADS);

    for(int i = 0; i < NUMRUNS; i++) {
      x = 0;
      wait = true;

      for(int j=0; j < NUMTHREADS; j++) threads[j] = std::thread(increment_x);

      wait = false;
      for (auto& th : threads) th.join();
      results[x-1] += 1;
    }
    for(int i = 0; i < NUMTHREADS; i++) std::cout <<  results[i] << " ";
}
There are two reasons why “count the end states” misestimates the likelihood. First, it assumes there’s only one path per end state. To see why this is a problem, here’s the state space for two threads:
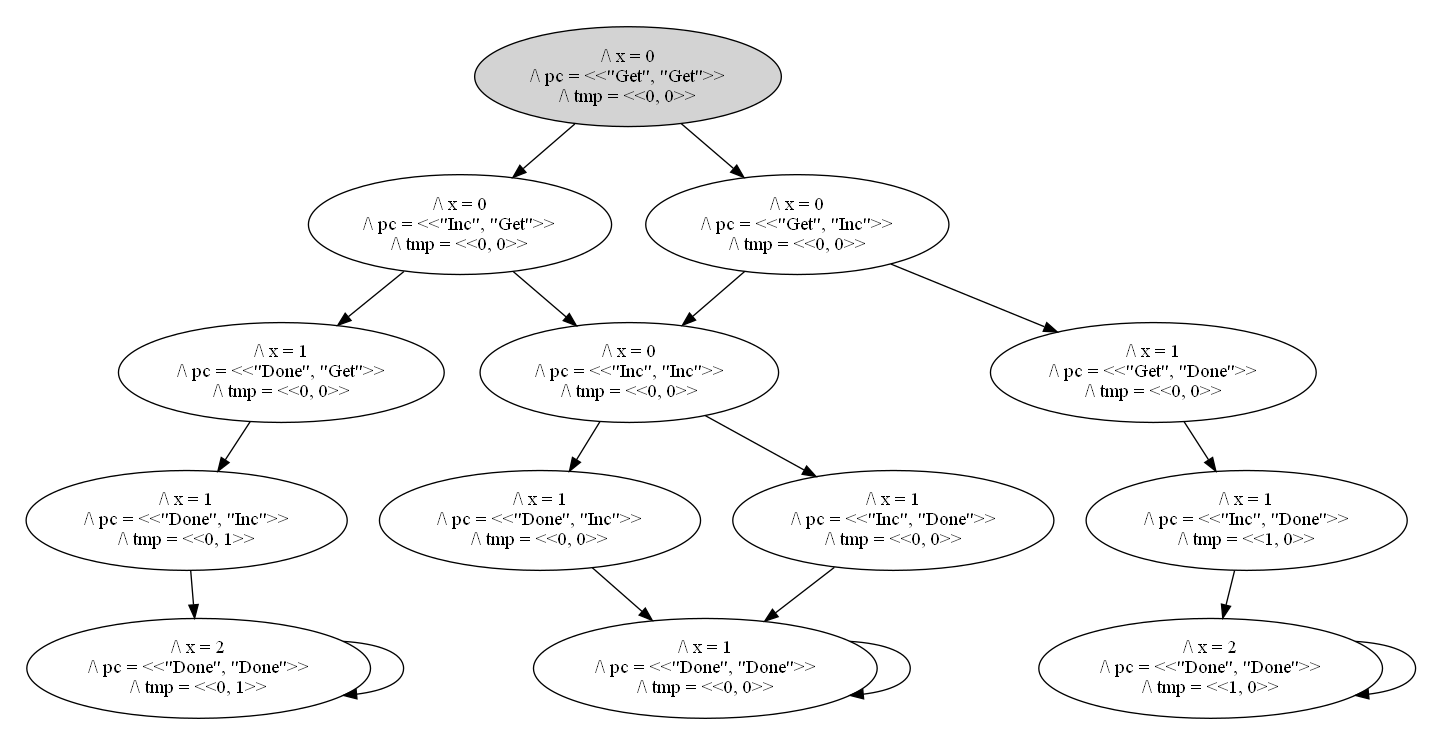
The space has three end states, and x = 2 in two of those. But there are four paths to those three end states; two of them end in x = 1. That means it’s twice as likely to happen as either of the other states, assuming all transitions are equally likely.
And that’s the second issue: all transitions are not equally likely. In the spec, a Get followed by a second Get represents one thread interrupting another. Threads (on Windows) get 20ms slices at a time, and both assignment and increment operations both happen on the nanosecond scale. Each thread will more often complete both operations than complete one and then get interrupted. So two consecutive Gets should happen pretty rarely.
“Pretty rarely” isn’t a concept in TLA+: either a state is possible or it isn’t.5 Figuring out the state’s likelihood is out of scope for the language. But with graph analysis, we’ve expanded the scope, and maybe that’ll be enough to get something interesting. I feel really out of my depth here and am learning this all as I go, but let’s give it a shot anyway.
So let’s say that if a thread takes an action, like Get, it’s more likely that thread will Inc than that the other thread will interrupt it and Get. As a very rough substitute, we’ll say that Inc transitions have more “weight” than Get transitions do.
In the first two images, we have only Gets and only Incs, so each transition is equally likely to happen. In the final image, we have one of each. If I weight each Inc as 3 times heavier than a Get, then it’ll happen 75% of the time. If we instead had 2 Incs and a Get, each Inc would happen 3/7ths the time and the Get would happen 1/7th.
That gives us the probability, given a state, of which edge we take. Now what’s the likelihood of reaching a given state? Let’s walk through an example state space:
, all edges have different weights")
I marked the weight of each edge. Now let’s walk through the likelihoods of each node:
- R is the single root node, so it has likelihood
1. - R is equally likely of going to A or B, so they each have likelihood
0.5. - A goes to C 50% of the time. But we have to get to A to get to C, and that only happens 50% of the time! So the likelihood of C is
0.5*0.5 = 0.25. - Similar logic shows that the likelihood of E is
0.5*0.75 = 0.375. - The most interesting case is D. We can reach it from either A or B. So its likelihood is the sum of the two paths, or
0.375.
(This only works because there are no cycles in the state space. IIRC the technique broadly works with cycles, but you have to keep doing iterations over the graph until the likelihoods converge. This is basically the idea behind representing probabilistic systems as a stochastic matrix.)
Now we have our algorithm for calculating each state likelihood. Then if we take all the terminal states with x={k} and sum their likelihoods, we’ll have the proper probability that we end with x={k}. Repeat for every {k} and we have the distribution of end values!
I implemented this algorithm, but explaining the code took 1,000 words and this essay is already long enough as it is. So I hosted the code elsewhere.
7. Compile this all into a github repo
Link here. It contains all of the work I put into this experiment:
- A copy of the TLA+ spec, which you can use to generate new state space graphs
- Five premade state space graphs, so you don’t have to learn how to use TLA+
- A (python) script to make the graph nodes a little more readable
- A python script that calculates the probabilistic property, along with notes and commentary on the code
- A Gephi workspace with all the hard cleanup work already done for you
- A PRISM probabilistic model of the same problem, just because.
I wrote it to be easy to study, so you can experiment with it too. I hope you find it useful!
To close out the experiment, let’s find some likelihoods:
python likelihoods.py graphs/2_threads.dot --weight 1
Counter({2: 0.5, 1: 0.5})

python likelihoods.py graphs/2_threads.dot --weight 10
Counter({2: 0.91, 1: 0.09})

python likelihoods.py graphs/2_threads.dot --weight 100
Counter({2: 0.9901, 1: 0.0099})
Thoughts
I’m excited about what this opens up! I’m hopeful the approach scales up to larger state spaces, too; it seems the majority of the script runtime is spent on importing the graphviz into NetworkX, the actual graph computations finish much faster. Even if it NetworkX doesn’t scale, maybe a more ergonomic graph analysis library would.
And man it’s feels good doing a blog post on advanced TLA+ use again. It’s been over a year since the last time. I enjoy writing material for beginners but it doesn’t scratch the same itch.
Anyway if you enjoyed this, I’m running a 1 day TLA+ workshop in May and have a newsletter I update weekly.
Thanks to Jay Parlar, Lorin Hochstein, and Andrew Helwer for feedback.
- The project repo uses a python script instead to cut down on the number of dependencies. [return]
- Recently the Gephi team announced Gephi Lite, which among other things supports custom javascript node attributes. It doesn’t yet support graphviz import, though it’s still a work in progress. [return]
- Nodes have node neighbors, node neighbors have connecting edges, connecting edges have attributes. [return]
- I couldn’t get shared memory working in Rust and I was suspicious Python’s Global Interpreter Lock would artificially depress the racecond rate. Shoutout to GPT4 for helping me bumble my way through C++ [return]
- In contrast, PRISM is a probabilistic model checker that can calculate state likelihoods without you having to dump state spaces into another program. Then again PRISM doesn’t have functions or arrays so writing the spec in the first place is a big pain in the butt. I ended up modeling the system in PRISM for fun; you can see it here. [return]