Comment Section: The Hunt For The Missing Data Type
I got a lot of responses to The Hunt For the Missing Data Type. I’ve included some of the most interesting ones below.
Response Blogs
Emails and Comments
Everything in quotes is verbatim.
GraphBLAS
My name is Michel Pelletier, I’m one of the contributors to the GraphBLAS API standard and python bindings.
Congrats on your blog going up to the front page on HN. I replied with some information that I think you might find useful to your question, but it’s pretty buried under a lot of the discussion there. I noticed that you invite people to email you, so I decided to send you the information directly.
The graph data type you’re missing is the one you already mentioned, a matrix. You mention adjacency matrices, but in the context of your blog post, they’re considered only a storage format, not the graph itself. But graphs and matrices are conceptually and algebraically isomorphic. All graphs, and thus all composite data structures, are mathematically matrices, and all matrices are graphs. Hypergraphs and Multigraphs are represented by “Incidence Matrices” which are node-to-edge to edge-to-node adjacencies using two rectangular matrices.
A really excellent introductory paper by a large group of researchers, spearheaded by Dr. Jeremy Kepner, Director of the Supercomputing Center and MITs Lincoln Laboratory is:
https://arxiv.org/pdf/1606.05790.pdf
The issue with computers and thinking of graphs as matrices is that most graphs are sparse, and most matrix libraries (like numpy) are dense. This makes using adjacency matrices very expensive, since most of the “space” in a dense matrix ends up being zero. This is extremely inefficient and defeats cache hierarchies typical of von Neumann architectures. These two worlds have not quite converged yet.
There is however a lot of research and development around efficient sparse matrix computation, and thus, sparse graph analysis. While these may seem different, they are actually one in the same: matrix multiplication is a breadth first step across a graph. This is part of the isomorphic nature between them. A lot of ML and AI research involves both sparse matrices and graphs, and this research is very much unified in improving the performance of both paradigms.
A big question I get about this is “why”. Why write a linear algebraic formula instead of a function that traverses the nodes and edges? And one of the most important answers is parallelization over huge graphs. When graphs get really, really big, billions or trillions of edges, you need to divide the work of your algorithm efficiently. How are you going to do that? Fork every edge? Use a thread pool? How to schedule the work and partition the graph efficiently? Now do that on CUDA… the problem becomes almost impossible for even the smartest programmers to tackle.
With the GraphBLAS, a graph operation is a linear algebraic formula, decomposed into a series of matrix multiplications, you just say something like Ax = b, and the underlying library figures out how to do the work most efficiently on a specific target architecture. Run it on a chromebook or a supercomputer, the code doesn’t change, just the capacity of the machine for bigger graphs. You can think of the GraphBLAS as a language that can be “JIT” compiled based not only on the underlying architecture but also the shape and type of problem you feed it. Since LA is the universal language of math, science and engineering, this technique has natural application to a lot of existing work.
So I just wanted to send that your way, good luck on your further exploration of the subject. I’m happy to chat with you anytime if you’d like to find out more, as a member of the C API Committee, evangelizing is part of my job and I enjoy introducing the subject.
Thanks!
Gremlin
In earlier drafts of the essay I talked about TinkerPop, Apache’s graph computing framework, and Gremlin, the query language. I removed it from the final version, and several people noticed it was missing. Here’s one response.
You mentioned Cypher, but didn’t talk about Gremlin, which is an expressive graph query language for Neo4j/TinkerPop:
It was used to power the Joern SAST tool that was acquired by ShiftLeft, and I think is used a lot in the finance world.
I last used it to make a graph of all of the software packages in Maven and their interdependencies.
It’s got nice bindings into programming languages - I used Python Gremlin so I could drive it from a familiar scripting language, since the default REPL/script is Groovy that I’m not so handy with.
You can interchange between querying the graph with Gremlin and doing “normal” imperative scripting in Python, then do further querying from the results. It felt quite natural.
I don’t know about the state of whole graph algorithms for it - I was always interested in traversal-based queries vs whole graph statistics like centrality.
Rubik’s Cubes
I ran across your article about missing software libraries for graphs because it was linked from the CodeProject newsletter. It was a wonderful article. I’m not of the same caliber as the people you consulted when you were writing the article, but nevertheless I thought I would offer you one more example of the difficulties in creating generic software libraries for graphs. Namely, I’m a part of a very informal group of people who have been using computers for years to investigate the mathematics of Rubik’s Cube.
The math underlying Rubik’s Cube is called group theory and one of the things you can do with groups is to map them out with graphs called Cayley graphs. That know-it-all called Google describes it as follows: “Cayley graphs are frequently used to render the abstract structure of a group easily visible by way of representing this structure in graph form. Properties of a group G, such as its size or number of generators, become much easier to examine when G is rendered as a Cayley graph.” In particular, each possible Rubik’s Cube position can be represented as a node in a Cayley graph and adjacent nodes are those which can be reached in exactly one move. You mentioned the 15 puzzle your article. It turns out that one of the Rubik’s Cube investigators has written a complete and very fast solver for the 15 puzzle. And it also turns out that the size of the 15 puzzle is a drop in the bucket as compared to the size of the Cayley graph for Rubik’s Cube.
In any case, I have been writing code since 1985 to investigate Rubik’s Cube. This is not just to “solve” Rubik’s Cube, which is actually quite easy. Rather, it’s to determine for each of the nearly 10^20 positions the least number of moves that are required to solve position. The problem remains unsolved simply because it is so large. It has been determined that any position can be solved in either 20 moves or in 26 moves, depending on what you count as one move. But that’s not the same thing as finding the solution for each possible position that requires the least possible number of moves.
In any case, I know from much experience that I have had to develop my own data structures that are quite specific to Rubik’s Cube in order to address the problem in any practical manner. The key issue (and here I’m quoting from your article) is that Performance Is Too Important. No libraries I could find did what I needed, so I rolled my own.
Thanks for a wonderful article,
Jerry
I asked for more information on what “20 or 26” moves meant and whether he could share more about the data structures he uses. His reply:
As you guessed, whether you count a single half rotation as one move or two is the primary example of what counts as one move. If you only count quarter rotations as one move, then that’s called the quarter turn metric. Any position can be solved in 26 moves in this metric. If you count either quarter rotations or half rotations as one move, then that’s called the face turn metric. Any position can be solved in 20 moves in this metric. But there are other ways to choose what counts as one move. A Rubik’s Cube has three layers in any direction. Typically you only count moves of the outer layers such as the top and bottom but not the layer in between the top and bottom or the outer layers such as the right and left but not the layer between the right and left. But it is sometimes interesting to count moves of those middle layers as one move. Another variation is the stuck axle problem where you pretend one of the axles is stuck. For example, you don’t move the top face and only move the layers on the other five faces of the cube. With this variation, you can still reach all the possible positions but the Cayley graph does not have the same symmetry as it would have if none of the axles were stuck. Also, many more moves can be required to solve a cube with a stuck axle than the standard 20 moves or 26 moves.
I don’t think there is any standard data structure for Rubik’s Cube. Each person working on the cube has their own, except that there is an obvious sense that any data structure that faithfully represents the cube has to be somewhat isomorphic to any other data structure that faithfully represents the cube. A big distinction is whether the data structure consists only of positions or whether it consists both of positions and moves. For example, two consecutive clockwise quarter turns of the front face results in the same position as two consecutive counter-clockwise quarter turns of the front face. In a Cayley graph, these move sequences become a loop if continued. The loop is a four move cycle (a 4-cycle). So do you store moves and positions, or do you just store positions?
I really don’t know how anybody else’s data structures handles these issues. For myself, I don’t explicitly store the entire Cayley graph. Instead, I store positions and with each position I store single bit for each possible move from that position that indicates whether the move takes you further from the solved position or closer to the solved position. There are 12 such bits for each position in the quarter turn metric and 18 such bits for each position in the face turn metric. Those bits implicitly define a Cayley graph, but I do not store the graph explicitly. Other people working on the problem talk about using canonical sequences of moves, for example you can make two successive clockwise moves of the front face but not two successive counter-clockwise moves of the front face. I do something similar but not exactly the same using my bits.
The other issue is that I needed a tree structure and a tree can be thought of as a special case of a graph. Which is to say, a tree is just a graph where one node is declared to be a root node and where there are no loops in the graph. I had to roll my own tree structure. The tree structure I needed arises as follows. There are 54 color tabs on a standard Rubik’s Cube. In the standard mathematical model, the center color tab on each face does not move which leaves 48 color tabs which move. Of the 48 color tabs, 24 are on the corners of 3x3 squares and 24 are on the edges of 3x3 squares. The corner color tabs and edge color tabs are disjoint, so I represent a cube position by labeling each corner color tab with a letter from A to X and by labeling each edge color tab with a letter from A to X. Each position is then an ordered pair of words where each word consists of 24 letters and where each letter appears exactly one time in each word.
So why do I need a tree? Well, I need to be able to find these words very quickly. It’s like finding words very quickly in a spell check dictionary. Nominally, each node in the tree needs 24 pointers to other nodes in the tree. Except that unlike real words in a real spell check dictionary, each letter can appear only one time in each word. So as I get towards the leaf nodes of the tree, each node is going to consist mostly of null pointers, a huge waste of very valuable memory. So I had to create a tree structure to accommodate the storage of the positions for fast retrieval. No standard library routines were fast enough and conservative enough of memory.
So essentially I have two data structures layered together. One of them uses bit switches to define the Cayley graph for the cube, and the other of them uses a spell check dictionary style tree to locate specific positions very quickly. And trees are just special cases of graphs.
I don’t know if that answers your questions, but I hope it helps.
Jerry
Graphs and knowledge databases
Hillel — Thank you for sharing your exploration of graph representations with clear explanations as to why there is no clear winner. I’m wondering if the problems you cite aren’t so large as to preclude viable alternatives.
I come to this question first as a Smalltalk programmer and then as the creator of Wiki. Both have a graph like structure assembled in bits and persistent in use. The small community around my most recent wiki implementation is highly motivated to add graphs to pages along with paragraphs, images, outline, and tables. We have partially met this with Graphviz using Dot as a markup. But this does not yield to the computation and sharing as we get with files of yaml or csv.
We’ve recently adopted the practice of representing graphs (in javascript, for example) as an object with arrays for nodes and relations. The empty graph would be:
{nodes:[], rels:[]}Nodes and relations are themselves objects with a string for type and an additional object for properties and some managed indices that hook them together. This then serializes conveniently into (loop free) json, a format widespread and adequate for graphs measured in kilobytes.
These graphs converts easily into Neo4j objects for which we have considerable experience. More often we avoid maintaining a database beyond wiki itself. Although we have also built a modest Cypher interpreter we have not found that useful. We have made the surprising discovery that we are more likely to merge many small graphs into the one that solves the problem at hand rather than build one large Neo4j graph and query out the graph needed to solve the same problem.
More recently we have come to separate problems into “aspects” based on cross-cutting concerns in the problem space. We might have tens of these graphs or even hundreds. We browse these as one might browse a wiki where the equivalent of a wiki-link comes from recognizing the same node appearing in yet-to-be-included graphs. This is a “recommending” process and query is replaced by choosing and un-choosing recommendations with work-in-progress rendered immediately with Graphviz running in the browser.
I started this email with a more complete description of our graph abstraction but stepped back from that as I was unsure you would find our experience interesting. I could also describe applications where this has proven useful usually involving some collaboration problem within a community.
I would love to correspond if you think there is any overlap in interests.
Thank you and best regards — Ward
His code for this is avaiable here, along with docs and examples. Followup email:
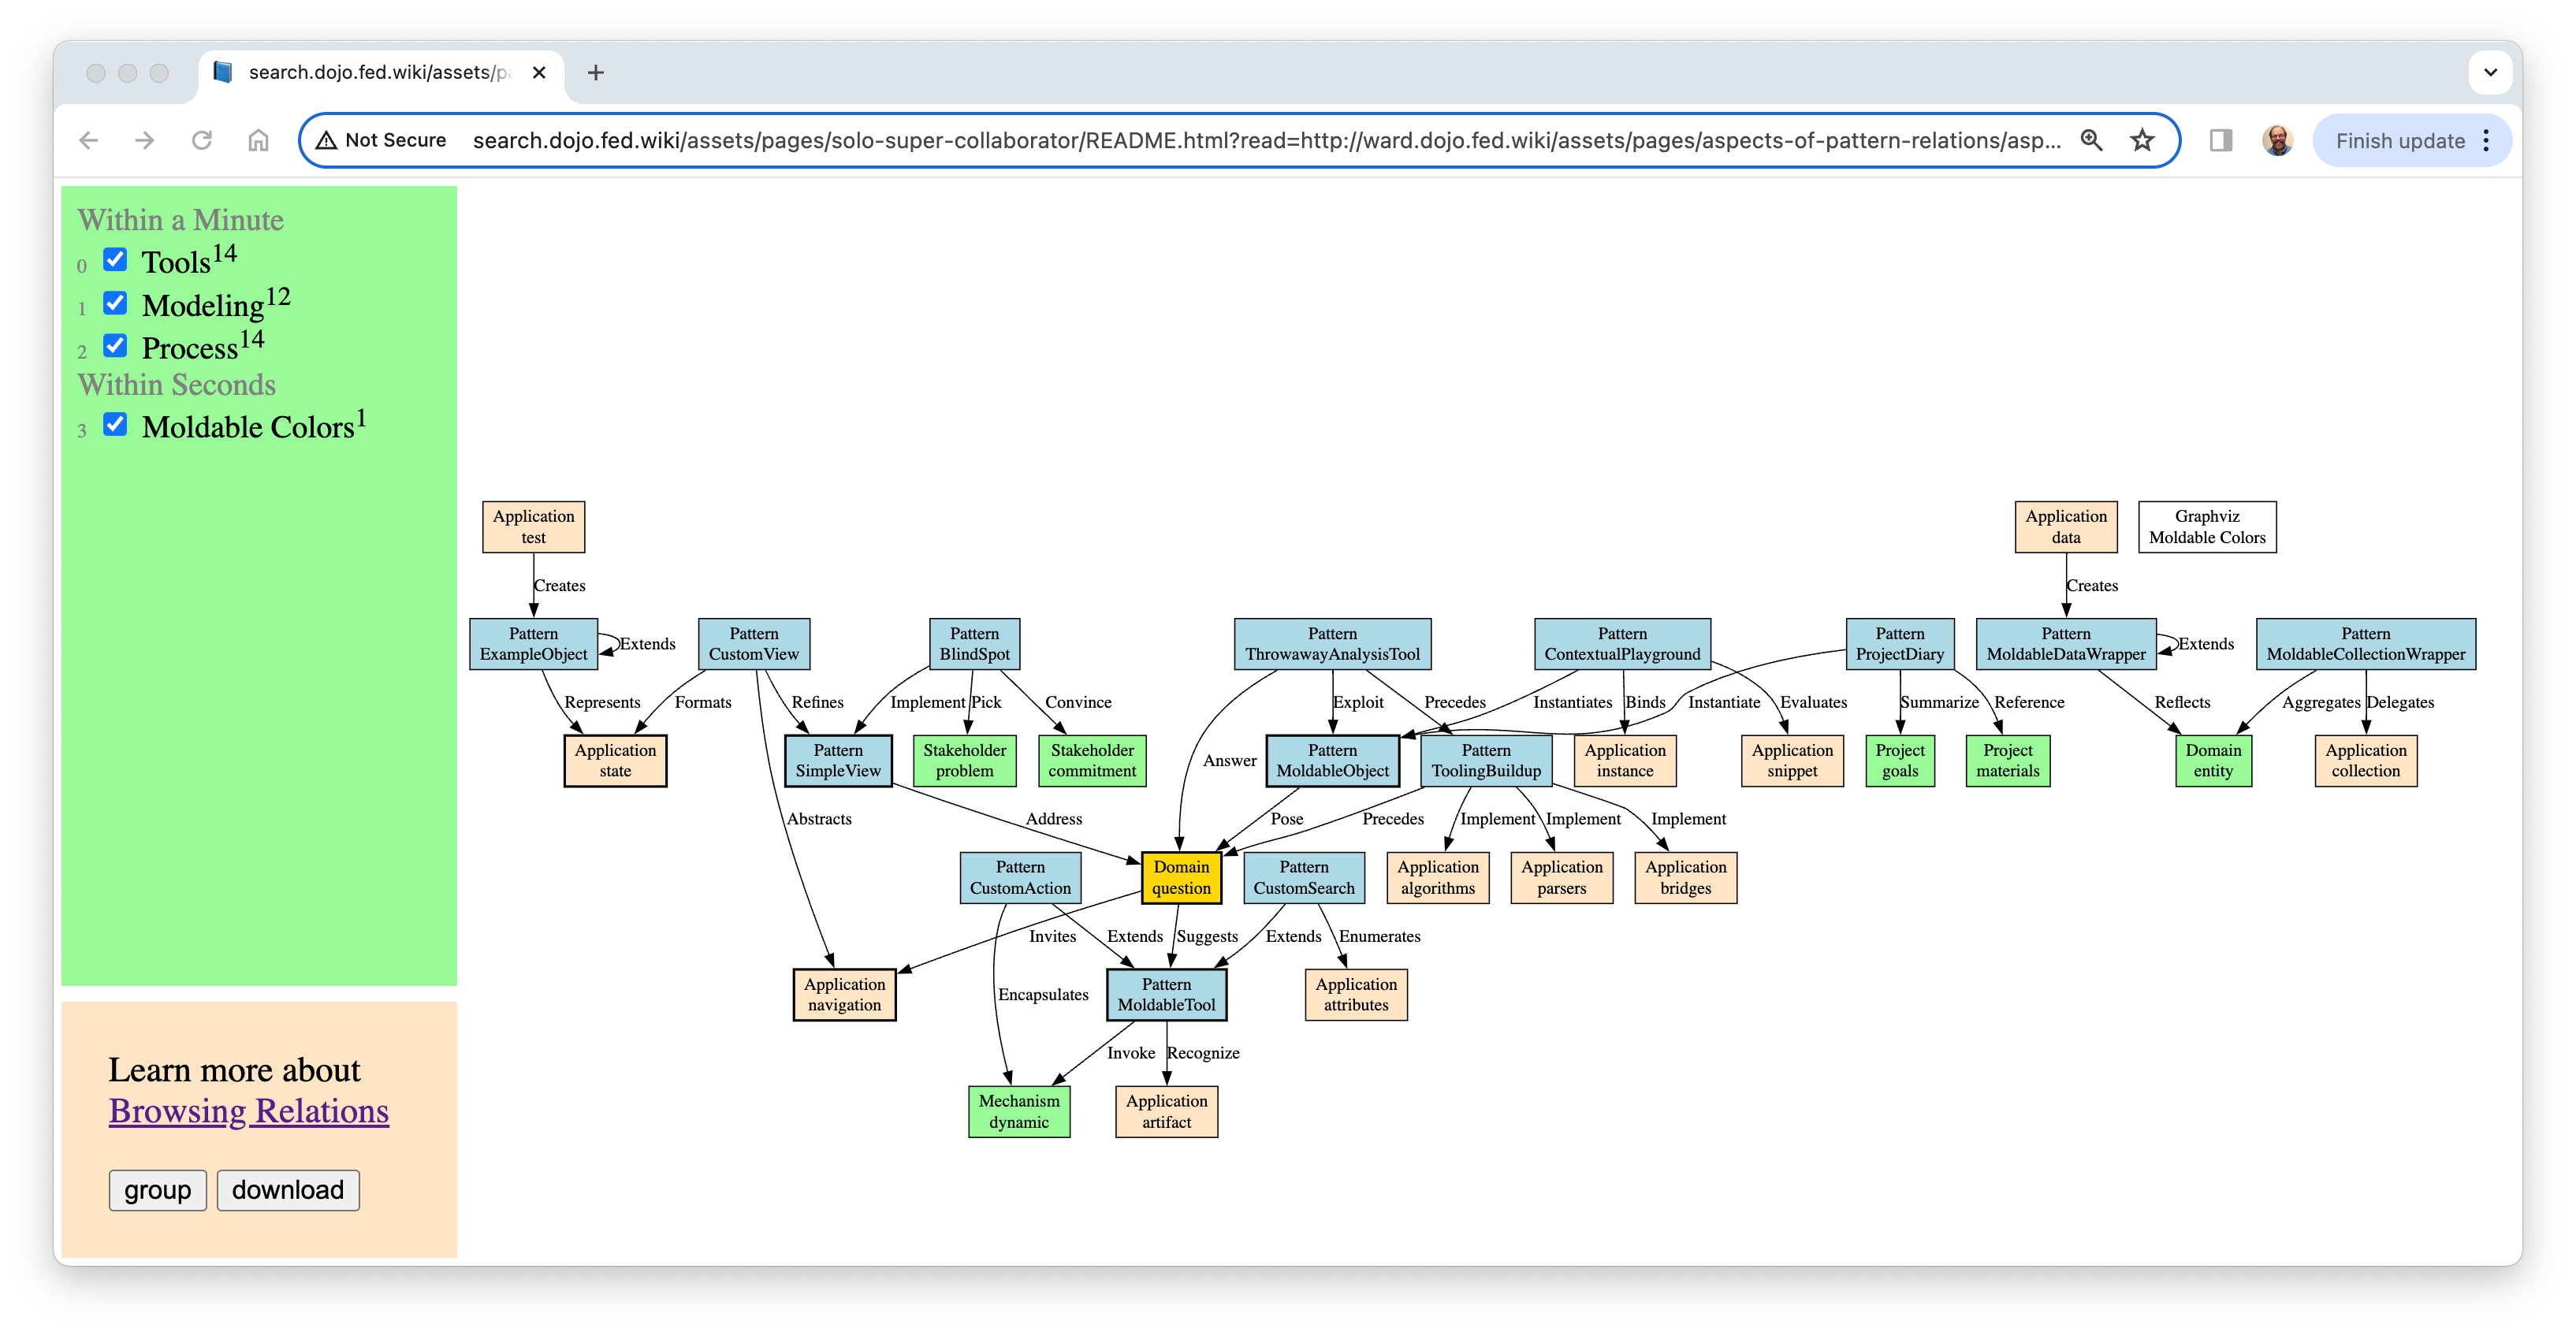
Hillel — We are on the hunt for small graphs representing aspects of larger problems. Here is a case where when asked to read a paper headed to the European Patterns conference I chose to read it very carefully and map every “relational” sentence in their patterns. Here is a picture where the an unexpected overlap between aspects is shown in yellow.
This particular graph viewer has had a circuitous life: started as scripts on wiki pages; extracted as a stand-alone web app on top of Croquet for online collaboration; then here as a single-user “solo” application heading back into wiki. It is not yet self-explanatory. But you can bring it up with the “open” link in the last paragraph of the wiki page where I coordinated with a co-reviewer who shares an interest in this sort of exploration. http://ward.dojo.fed.wiki/aspects-of-pattern-relations.html
Two more similar projects that show off different “aspect” possibilities: Chopping up a year of recent changes, and, annotating a search engine source code with node-relation comments and extracting them into graph files with GitHub actions.